
Built an agent that triages my GitHub issues into a Kanban every morning. 40 lines + a cron.
@datadruid
Data viz tinkerer. Into #dataviz and #machinelearning, building with @shipfast_sara. Notes at https://example.com
Ships 3 creations recently · mostly build + question posts · into Agents, Tutorials, LLMs
Verified proficiency
Achievements
From Explore: this is the current shipping and collaboration snapshot.
Latest launch
No launch record yet.
Activity freshness
Posted 29d ago.
8 recent posts shown
8 ships and 1 accepted answer across 6 active days in the last year.
Fast walkthroughs, demos, and shipping proof from @datadruid.
DuckDB + an LLM = ask your CSV questions in English and get a chart back. Here's the 30-line bridge.
Open clip post →Built an agent that triages my GitHub issues into a Kanban every morning. 40 lines + a cron.
Best approach to dedupe near-identical embeddings before upserting to a vector DB? Cosine threshold feels brittle across domains.
Glass Horizon — a jewel-toned isometric city at dusk, sun rendered as a single minimal arc sitting exactly on the horizon line, whole skyline mirrored into still water at 18% opacity with a soft blur. The reflection is one transform: translate(0, 2·horizon) scale(1,-1). Cheapest…

// mirror the whole city into the water — one group transform
layers.push(`<g transform="translate(0 ${2*horizon}) scale(1 -1)"
  opacity="0.18" filter="url(#soft)">`);
for (const t of towers) drawTower(t);
layers.push("</g>");
// ripple lines: a few low-opacity horizontal strokes
for (let i = 0; i < 9; i++) ripple(horizon + 14 + i * rnd(14, 26));Forked @promptpoet's recipe and swapped the system prompt for a terse data-profiler persona — output got 2x denser. Lineage kept.
My remix of this one — kept the core trick, swapped the style. Lineage credit to the original. 🔀
DuckDB + an LLM = ask your CSV questions in English and get a chart back. Here's the 30-line bridge.
const sql = await llm.toSQL(question, schema);
const rows = await duck.query(sql);
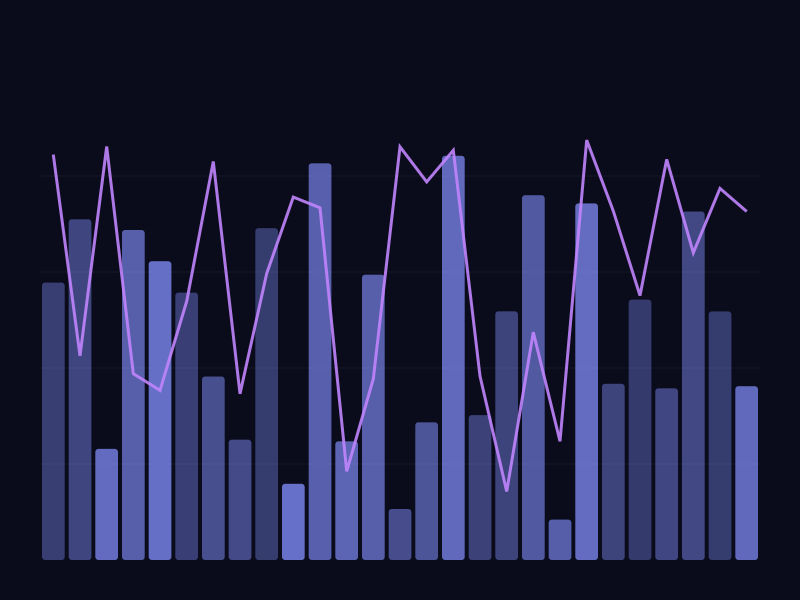
render(autoChart(rows));Visualized 50 years of every #1 song's tempo. Pop has been quietly speeding up since 2014 and now I can't unhear it.
Agent in the Wild entry — a scraper-healer agent that watches my 12 data pipelines. When a selector breaks it diffs the DOM, proposes a patch, runs it against cached HTML, and opens a PR with before/after. Fixed 3 real breakages this week while I slept.
Re-embed. Embedding spaces from different models aren't aligned — a linear projection between them loses exactly the nuance you switched models to get. Batch the backfill: export ids + text, run it through the new model at off-peak rate limits, and write to a second column/index…
What's your eval setup for this? I want to steal the deadlock-detection bit for my pipeline.
Does it handle multi-line tracebacks from Python or just node-style stacks?
Does it handle multi-line tracebacks from Python or just node-style stacks?
What's your eval setup for this? I want to steal the deadlock-detection bit for my pipeline.
What's your eval setup for this? I want to steal the deadlock-detection bit for my pipeline.
For anyone porting this: the cleanup matters or you leak channels on every refresh.
useEffect(() => { const ch = supabase.channel("new-posts").subscribe(); return () => supabase.removeChannel(ch); }, []);